
Data Mining
In the era of big data, how to extract useful information from data becomes important. Machine learning algorithms can help you understand the true meaning behind your data.

Machine Learning
Our applications combine multiple machine learning techniques to help you discover the true meaning behind your data.

Cluster2A
Cluster analysis is often used in customer segmentation, product recommendations, and outlier detection.

RuleMining2A
Association analysis is often used in product recommendations, promotional pricing, and product placement.

Allocate3M
Resource allocation is commonly used in project management to increase growth rates or reduce volatility.

Career3A
Team analysis is often used to promote cohesion among team members.

Macro3M
Economic indicators are often used to analyze and predict macroeconomic trends.

SalesTSK
Establishing clear sales steps in the sales process is often the key to success.

Cluster Analysis
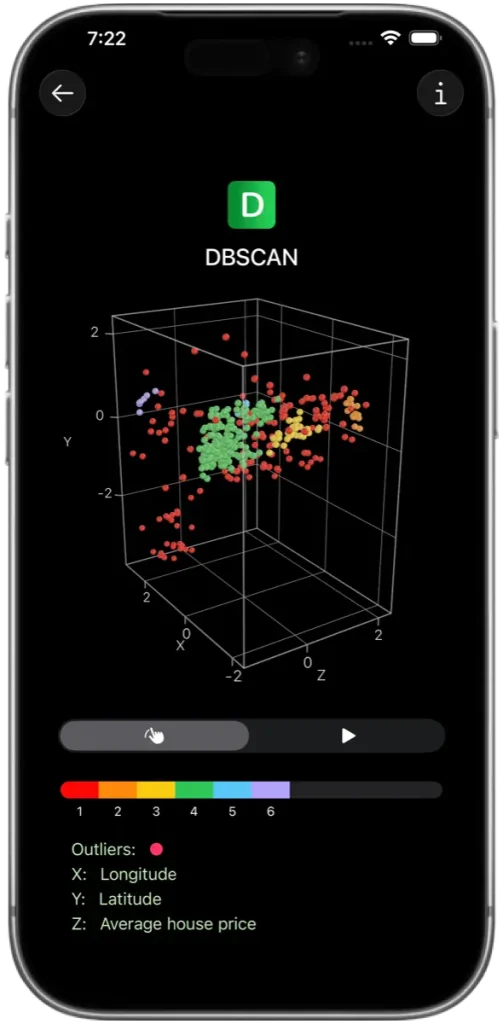
Cluster2A
Machine learning has become a powerful tool, revolutionizing how industries operate. Unsupervised learning is a machine learning method that analyzes and discovers hidden patterns, structures, or relationships in unclassified or unlabeled data. It is widely used to improve customer experience, provide personalized recommendations, optimize operations, and drive innovation. K-means and DBSCAN are two commonly used unsupervised learning algorithms.
Common application scenarios:
Customer and market segmentation: Grouping customers based on their behavior, demographic characteristics, or purchase history for targeted marketing and personalized recommendations.
Retail analytics: Identifying “hotspot areas” in a store through cluster analysis of customer locations.
Cluster2A combines two machine learning algorithms, K-means and DBSCAN, to help users with small datasets take their first steps into the world of machine learning more easily and enjoyably.
Association Analysis
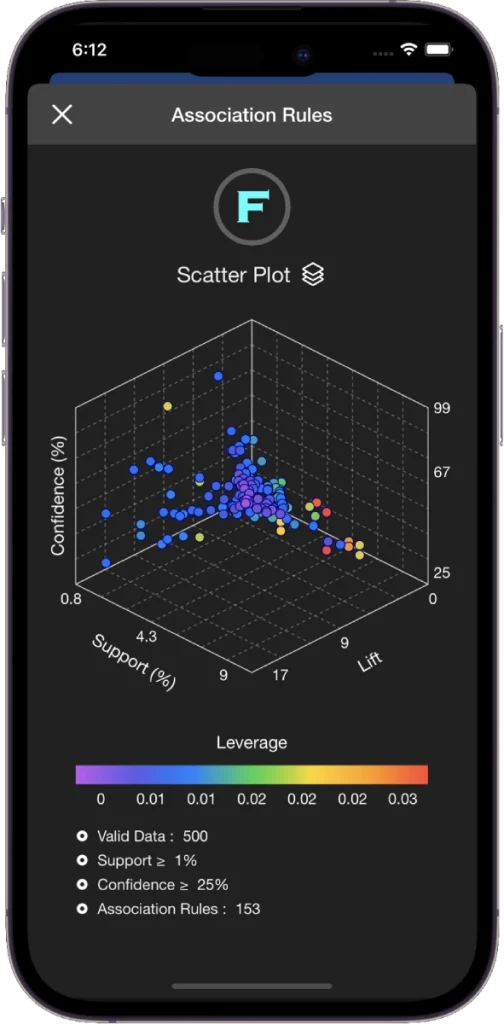
RuleMining2A
Association analysis is often used to discover implicit associations between items in large datasets, and the discovered associations can be expressed in the form of association rules. Association rules are often used to find new cross-selling opportunities. RuleMining2A uses two classic association analysis algorithms, Apriori and FP-Growth, to assist you in finding association rules between items in the dataset.
For example, the rule {pasta} ⇒ {shrimp} found from sales data means that customers who purchase pasta are also likely to purchase shrimp. This information can be used as the basis for marketing decisions such as product recommendations, promotional pricing, and product placement.
Resource Allocation
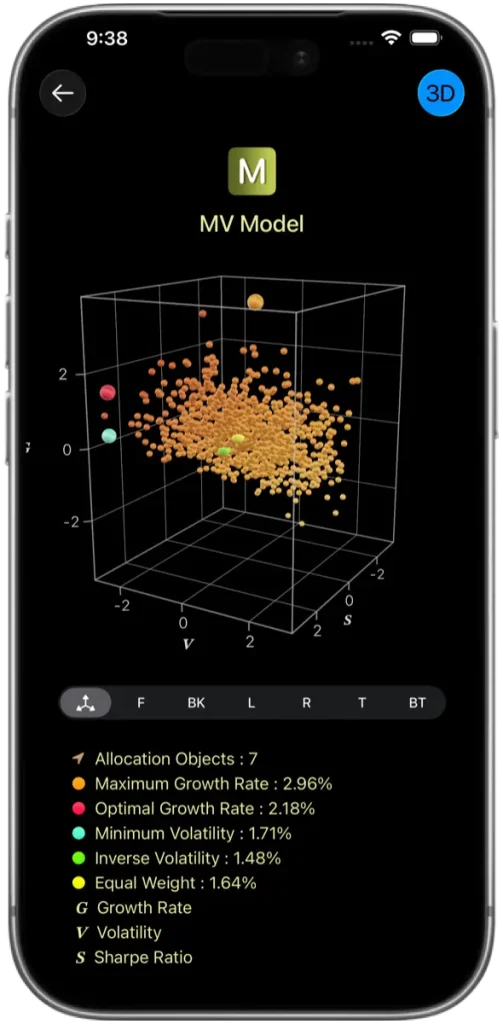
Allocate3M
Machine learning and data analytics are increasingly being used for resource allocation, increasing growth rates or reducing volatility by allocating limited financial, human, technological, time, or natural resources to the tasks and projects that need them most. The “Mean-Variance” Model is the most classic resource allocation model and is widely used in various industries.
Common application scenarios:
1. Seeking the allocation weights with the highest growth rate under a specific level of volatility.
For example, you can allocate resources based on historical sales data from 500 European retail stores. The “Mean-Variance” model uses the Monte Carlo method to find a set of allocation weights that have the optimal sales growth rate.
2. Weights are assigned based on volatility in order to seek stability.
For example, you can allocate your procurement budget based on the historical raw material prices of 300 suppliers in the Asia-Pacific region. The “Risk-Parity” model uses Newton’s method to find a set of allocation weights with equal volatility to reduce the risk of raw material price fluctuations.
Allocate3M combines three models: “Mean-Variance”, “Black-Litterman”, and “Risk-Parity”, to help you optimize resource allocation results from different perspectives.
Team Analysis
Career3A
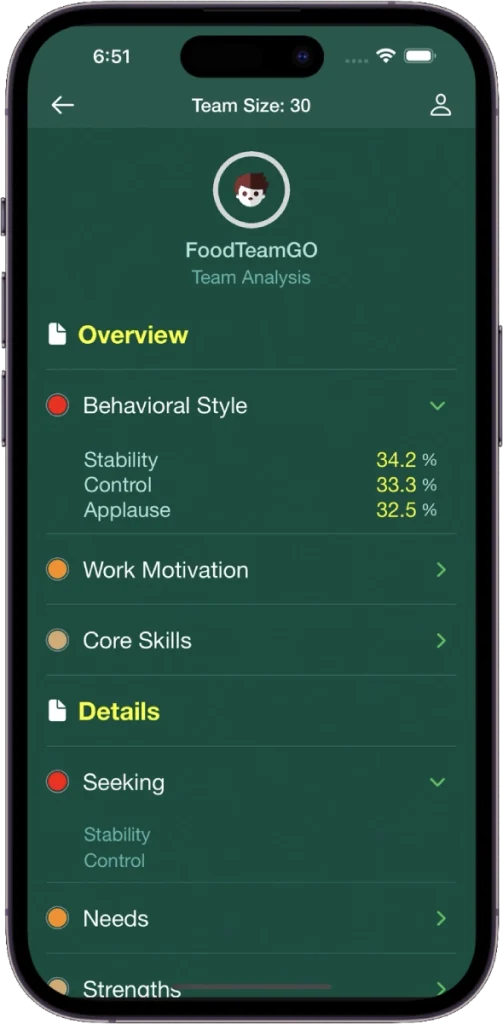
Career3A can quickly test your Behavioral style, Work motivation and Core skills. You can invite friends and colleagues to use Team Analysis to see test results for everyone. By learning more about yourself and those around you, you can better build relationships with friends and colleagues with different personalities.
Economic Analysis
Macro3M
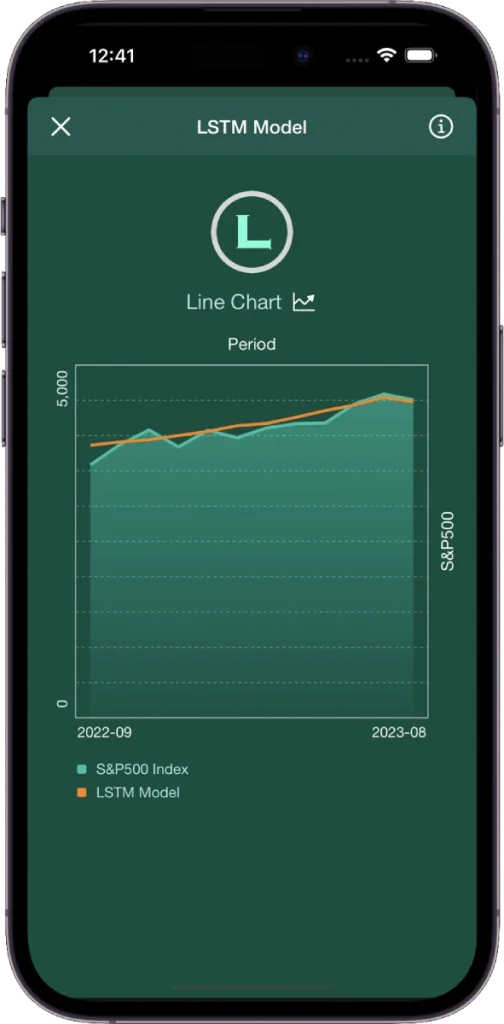
Economic indicators are statistics about economic activity. The dataset analyzed by Macro3M contains 14 U.S. economic indicators from 1967 to 2023, 4 of which are highly correlated with the U.S. market. The 4 indicators are M2 Money Supply, Producer Price Index, Industrial Production Index and Nonfarm Payrolls. These indicators help analyze the overall performance of the economy.
Macro3M uses three deep learning models (MLP, RNN, and LSTM) to analyze the impact of US economic indicators on the market, find patterns and build generalization models. You can input 4 indicator data to predict the market performance for the next month. In the long run, the market always fluctuates around the economy and tends to the same direction.
Sales Management
SalesTSK
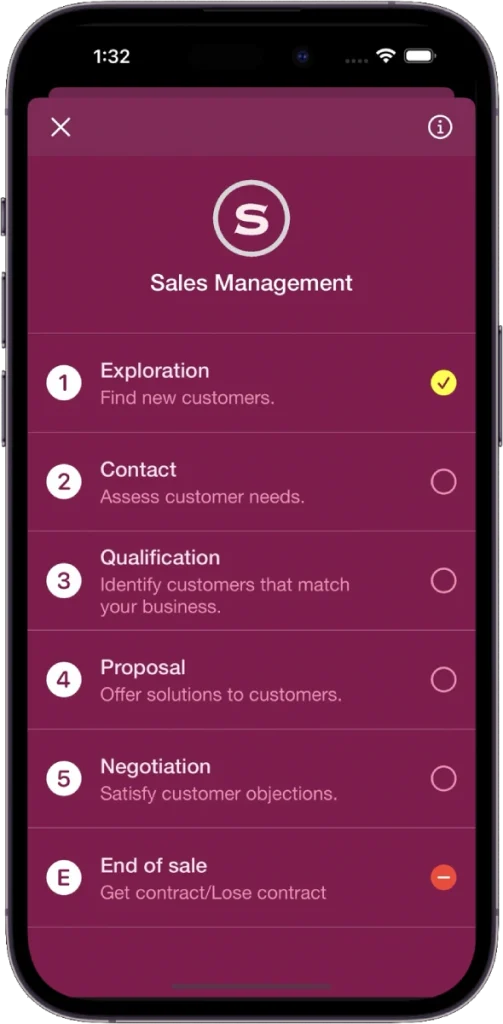
One of the best strategies for achieving good sales performance is to establish clear and appropriate sales steps in the sales process. SalesTSK combines time management and sales management knowledge to guide you to focus your limited time and energy on the sales process. You’ll feel better and more productive when your focus is no longer on results but on the sales process.
SalesTSK can calculate your sales metrics based on your sales data. Sales metrics include deal size, sales cycle, and success rate. You can look for bigger deals, shorter sales cycles and higher success rates to improve your sales performance.